Chart Game Person vs Monkey官方版免费下载游戏攻略
A stock investment game between monkeys and fund managers ended with the monkey's victory.
In Korea, there was a stock investment game between parrots and individual investors. it also ended with a parrot's victory.
Since these two games were conducted within less than 10 months, it is hard to say that 'monkeys are better than humans'.
Now let's start the game in a new way.
Monkeys and you are playing an investment game with same stocks.
When the game starts, a chart of stocks appear randomly.
Monkeys have already bought stocks one year ago at the time when the game begins, and you can buy and sell stocks by analyzing charts over a period of one year.
In other words, a monkey is a long-term investor who buys and holds stocks over a two-year period, and you are a short-term investor who can do short-term trading by analyzing your charts.
When the period of a year ends, you can compare your return with the monkeys', and you can extend the duration for investment if necessary. (Item required.)
When the investment is over, you can check which company you invested with the monkey, the period of time, and the company's information.
Win the competition with monkeys and increase your wealth to become the world's richest person.
► The data provided in the game is actual historical stock data for the US, South Korea, and Japan.
► The exchange rate in the game is $1 = ¥100 = ₩1000.
◆◆◆ You can analyze charts with various kinds of charts and indicators. ◆◆◆
Candlestick chart - A candlestick chart (also called Japanese candlestick chart) is a style of financial chart used to describe price movements of a security, derivative, or currency.
OHLC chart - An open-high-low-close chart (also OHLC) is a type of chart typically used to illustrate movements in the price of a financial instrument over time.
Area chart - An area chart or area graph displays graphically quantitative data. It is based on the line chart. The area between axis and line are commonly emphasized with colors, textures and hatchings. Commonly one compares two or more quantities with an area chart.
Renko chart - A renko chart is a type of financial chart of Japanese origin used in technical analysis that measures and plots price changes.
Kagi chart - The Kagi chart is a chart used for tracking price movements and to make decisions on purchasing stock.
Line chart - A line chart a type of chart which displays information as a series of data points called 'markers' connected by straight line segments.
Moving average - In statistics, a moving average is a calculation to analyze data points by creating a series of averages of different subsets of the full data set.
Bollinger Bands - Bollinger Bands are a type of statistical chart characterizing the prices and volatility over time of a financial instrument or commodity, using a formulaicmethod propounded by John Bollinger in the 1980s.
Parabolic SAR - In stock and securities market technical analysis, parabolic SAR (parabolic stop and reverse) is a method devised by J. Welles Wilder, Jr., to find potential reversals in the market price direction of traded goods such as securities or currency exchanges such as forex.
Volume chart - The Volume Chart shows the number of shares that have been traded over a given period.
MACD - MACD is a momentum and trend-following indicator that uses three different moving averages.
Force Index - The force index (FI) is an indicator used in technical analysis to illustrate how strong the actual buying or selling pressure is.
RSI(Relative Strength Index) - It is intended to chart the current and historical strength or weakness of a stock or market based on the closing prices of a recent trading period.
ATR - ATR is a volatility indicator. A high (or low) ATR indicates that a stock is more (or less) volatile.
Stochastic oscillator - In technical analysis of securities trading, the stochastic oscillator is a momentum indicator that uses support and resistance levels.
导读:期待已久的热门手游Ben 10 Game Generator 4D火爆来袭啦!这款手机游戏吸引了大批游戏玩家的的关注,有很多玩家都在问九游小编Ben 10 Game Generator 4D好玩吗?想知道这款手游怎么玩?今天小编就来说一下Ben 10 Game Generator 4D游戏介绍,带各位玩家详细了解一下这款手机游戏的所有玩法特点系统分析介绍,你就会知道Ben 10 Game G...
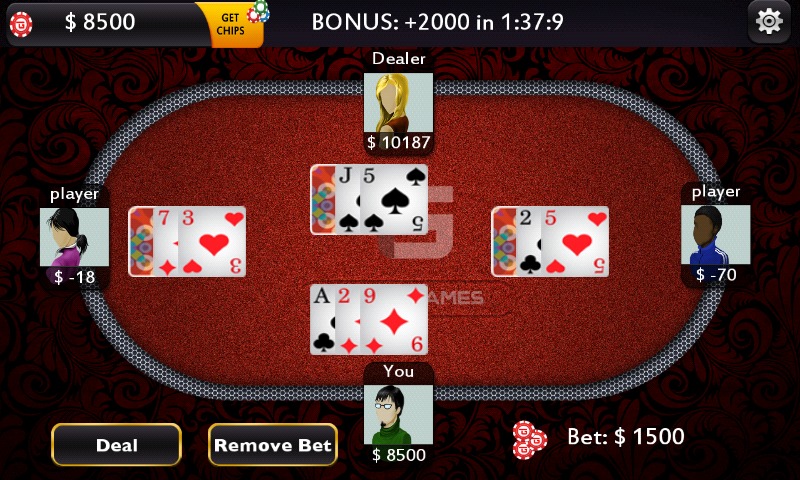
导读:期待已久的热门手游Card Poker game火爆来袭啦!这款手机游戏吸引了大批游戏玩家的的关注,有很多玩家都在问九游小编Card Poker game好玩吗?想知道这款手游怎么玩?今天九游小编就来说一下Card Poker game游戏介绍,带各位玩家详细了解一下这款手机游戏的所有玩法特点系统分析介绍,你就会知道Card Poker game究竟怎么玩,好不好玩了!
Poker is ...
Y game是一款近期十分热门的游戏,其有趣的玩法吸引了不少玩家的关注。有玩家反应找不到Y game九游版的下载地址,更不要说是最新版本了。要知道,想要赶快体验到游戏的真实内容和独特玩法,第一时间下载到游戏是关键。下面小编马上送上一个简单易懂的下载安装教程,轻松解决下载烦恼,让你马上玩到Y game九游版的最新版本。感兴趣的小伙伴赶紧来看看哦!
此游戏目前正在研发中,敬请预约!有测试消息、激活码...