游戏下载Chart Game Person vs Monkey游戏攻略
A stock investment game between monkeys and fund managers ended with the monkey's victory.
In Korea, there was a stock investment game between parrots and individual investors. it also ended with a parrot's victory.
Since these two games were conducted within less than 10 months, it is hard to say that 'monkeys are better than humans'.
Now let's start the game in a new way.
Monkeys and you are playing an investment game with same stocks.
When the game starts, a chart of stocks appear randomly.
Monkeys have already bought stocks one year ago at the time when the game begins, and you can buy and sell stocks by analyzing charts over a period of one year.
In other words, a monkey is a long-term investor who buys and holds stocks over a two-year period, and you are a short-term investor who can do short-term trading by analyzing your charts.
When the period of a year ends, you can compare your return with the monkeys', and you can extend the duration for investment if necessary. (Item required.)
When the investment is over, you can check which company you invested with the monkey, the period of time, and the company's information.
Win the competition with monkeys and increase your wealth to become the world's richest person.
► The data provided in the game is actual historical stock data for the US, South Korea, and Japan.
► The exchange rate in the game is $1 = ¥100 = ₩1000.
◆◆◆ You can analyze charts with various kinds of charts and indicators. ◆◆◆
Candlestick chart - A candlestick chart (also called Japanese candlestick chart) is a style of financial chart used to describe price movements of a security, derivative, or currency.
OHLC chart - An open-high-low-close chart (also OHLC) is a type of chart typically used to illustrate movements in the price of a financial instrument over time.
Area chart - An area chart or area graph displays graphically quantitative data. It is based on the line chart. The area between axis and line are commonly emphasized with colors, textures and hatchings. Commonly one compares two or more quantities with an area chart.
Renko chart - A renko chart is a type of financial chart of Japanese origin used in technical analysis that measures and plots price changes.
Kagi chart - The Kagi chart is a chart used for tracking price movements and to make decisions on purchasing stock.
Line chart - A line chart a type of chart which displays information as a series of data points called 'markers' connected by straight line segments.
Moving average - In statistics, a moving average is a calculation to analyze data points by creating a series of averages of different subsets of the full data set.
Bollinger Bands - Bollinger Bands are a type of statistical chart characterizing the prices and volatility over time of a financial instrument or commodity, using a formulaicmethod propounded by John Bollinger in the 1980s.
Parabolic SAR - In stock and securities market technical analysis, parabolic SAR (parabolic stop and reverse) is a method devised by J. Welles Wilder, Jr., to find potential reversals in the market price direction of traded goods such as securities or currency exchanges such as forex.
Volume chart - The Volume Chart shows the number of shares that have been traded over a given period.
MACD - MACD is a momentum and trend-following indicator that uses three different moving averages.
Force Index - The force index (FI) is an indicator used in technical analysis to illustrate how strong the actual buying or selling pressure is.
RSI(Relative Strength Index) - It is intended to chart the current and historical strength or weakness of a stock or market based on the closing prices of a recent trading period.
ATR - ATR is a volatility indicator. A high (or low) ATR indicates that a stock is more (or less) volatile.
Stochastic oscillator - In technical analysis of securities trading, the stochastic oscillator is a momentum indicator that uses support and resistance levels.
熟悉XBOX的人都知道,XBOX有两套并行的会员系统,一个是XBOX金会员,福利是每月免费领游戏;另外一个是XBOX Game Pass,福利是每月免费玩游戏。
具体来说,XBOX Game Pass会提供XBOX ONE/360平台上的100款游戏,玩家购买会员后,就可以在会员期间内免费畅玩了,另外玩家还能以优惠的价格直接购买这些游戏。
相较而言,XBOX Game Pass的游戏质量要...
Samsara Game第六关准备的道具是一个大梯形、一个小梯形,我么如何用这些道具通关呢?小伙伴们是不是也卡在这一关上了,下面一起和九游小编来看看Samsara Game第六关图文攻略。
Samsara Game全关卡图文攻略
Samsara Game第六关图文攻略
我们将大梯形方块,从下方开始放置,放在下面的石柱上面,
这样因为上面没有石柱,上面的方块就可以轻松搭建成个!
然后再...
根本没有游戏There is no game怎么过;根本没有游戏There is no game攻略;
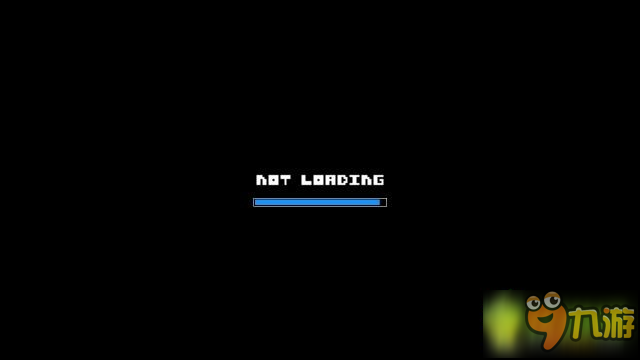
首先进入游戏,显示的这个画面
没有加载,嗯,有意思
然后旁白就出来啦,告诉你这里没有游戏,你可以去干干其他事情...
这时候我们就调皮的把O给点下来⭐
然后旁白让我们把O给安回去,可是怎么安都安不回去,于是我们发现了这个 ...