Chart Game Person vs Monkey怎么下载游戏攻略
A stock investment game between monkeys and fund managers ended with the monkey's victory.
In Korea, there was a stock investment game between parrots and individual investors. it also ended with a parrot's victory.
Since these two games were conducted within less than 10 months, it is hard to say that 'monkeys are better than humans'.
Now let's start the game in a new way.
Monkeys and you are playing an investment game with same stocks.
When the game starts, a chart of stocks appear randomly.
Monkeys have already bought stocks one year ago at the time when the game begins, and you can buy and sell stocks by analyzing charts over a period of one year.
In other words, a monkey is a long-term investor who buys and holds stocks over a two-year period, and you are a short-term investor who can do short-term trading by analyzing your charts.
When the period of a year ends, you can compare your return with the monkeys', and you can extend the duration for investment if necessary. (Item required.)
When the investment is over, you can check which company you invested with the monkey, the period of time, and the company's information.
Win the competition with monkeys and increase your wealth to become the world's richest person.
► The data provided in the game is actual historical stock data for the US, South Korea, and Japan.
► The exchange rate in the game is $1 = ¥100 = ₩1000.
◆◆◆ You can analyze charts with various kinds of charts and indicators. ◆◆◆
Candlestick chart - A candlestick chart (also called Japanese candlestick chart) is a style of financial chart used to describe price movements of a security, derivative, or currency.
OHLC chart - An open-high-low-close chart (also OHLC) is a type of chart typically used to illustrate movements in the price of a financial instrument over time.
Area chart - An area chart or area graph displays graphically quantitative data. It is based on the line chart. The area between axis and line are commonly emphasized with colors, textures and hatchings. Commonly one compares two or more quantities with an area chart.
Renko chart - A renko chart is a type of financial chart of Japanese origin used in technical analysis that measures and plots price changes.
Kagi chart - The Kagi chart is a chart used for tracking price movements and to make decisions on purchasing stock.
Line chart - A line chart a type of chart which displays information as a series of data points called 'markers' connected by straight line segments.
Moving average - In statistics, a moving average is a calculation to analyze data points by creating a series of averages of different subsets of the full data set.
Bollinger Bands - Bollinger Bands are a type of statistical chart characterizing the prices and volatility over time of a financial instrument or commodity, using a formulaicmethod propounded by John Bollinger in the 1980s.
Parabolic SAR - In stock and securities market technical analysis, parabolic SAR (parabolic stop and reverse) is a method devised by J. Welles Wilder, Jr., to find potential reversals in the market price direction of traded goods such as securities or currency exchanges such as forex.
Volume chart - The Volume Chart shows the number of shares that have been traded over a given period.
MACD - MACD is a momentum and trend-following indicator that uses three different moving averages.
Force Index - The force index (FI) is an indicator used in technical analysis to illustrate how strong the actual buying or selling pressure is.
RSI(Relative Strength Index) - It is intended to chart the current and historical strength or weakness of a stock or market based on the closing prices of a recent trading period.
ATR - ATR is a volatility indicator. A high (or low) ATR indicates that a stock is more (or less) volatile.
Stochastic oscillator - In technical analysis of securities trading, the stochastic oscillator is a momentum indicator that uses support and resistance levels.
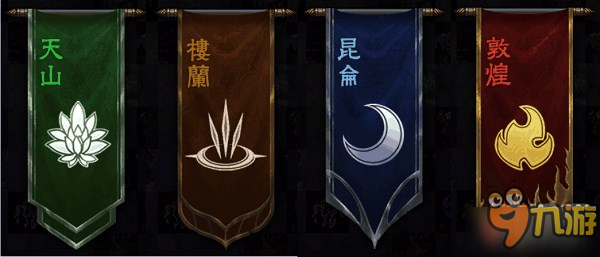
二测即将来临,各位将士最期待的国战也将再次降临!昔日国破家亡的耻辱,今日用屠城来祭奠;昔日江山一统的伟绩,今日用鲜血来拱卫!选择不同的阵营,让我们开启一段各为其主的战场厮杀岁月!
天山:卡卡的第一反应是:天山童姥、天山雪莲...雪域山城!
楼兰:卡卡的第一反应是:神秘、美女...游戏内的主城外观果然符合这一特点
昆仑:卡卡的第一反应是:神话、壮观的仙域...天上宫阙!
敦煌:卡卡的第一...
期待已久的手游balls vs lasrs球vs激光即将登陆九游,这款手机游戏吸引了大批玩家的关注,有很多粉丝都在问九游小编balls vs lasrs球vs激光好玩吗?balls vs lasrs球vs激光值不值得玩?现在就为大家来简单分析下,看看这款游戏的玩法特点和游戏剧情介绍。
1、balls vs lasrs球vs激光简要评析:
balls vs lasers球vs激光是抖音上非常火的...
Samsara Game第五关提供两个木块,一个梯形和一个正方形,我们如何使用这些道具进行通关呢?小伙伴们是不是也卡在这一关上了,下面一起和九游小编来看看Samsara Game第五关图文攻略。
Samsara Game全关卡图文攻略
Samsara Game第五关图文攻略
其实,这一关的操作,十分的简单~
我们在主角的面前,放入一个正方形方块,这样就可以完美衔接咯!
然后在离终点的...