Chart Game Person vs Monkey怎么下载到电脑游戏攻略
A stock investment game between monkeys and fund managers ended with the monkey's victory.
In Korea, there was a stock investment game between parrots and individual investors. it also ended with a parrot's victory.
Since these two games were conducted within less than 10 months, it is hard to say that 'monkeys are better than humans'.
Now let's start the game in a new way.
Monkeys and you are playing an investment game with same stocks.
When the game starts, a chart of stocks appear randomly.
Monkeys have already bought stocks one year ago at the time when the game begins, and you can buy and sell stocks by analyzing charts over a period of one year.
In other words, a monkey is a long-term investor who buys and holds stocks over a two-year period, and you are a short-term investor who can do short-term trading by analyzing your charts.
When the period of a year ends, you can compare your return with the monkeys', and you can extend the duration for investment if necessary. (Item required.)
When the investment is over, you can check which company you invested with the monkey, the period of time, and the company's information.
Win the competition with monkeys and increase your wealth to become the world's richest person.
► The data provided in the game is actual historical stock data for the US, South Korea, and Japan.
► The exchange rate in the game is $1 = ¥100 = ₩1000.
◆◆◆ You can analyze charts with various kinds of charts and indicators. ◆◆◆
Candlestick chart - A candlestick chart (also called Japanese candlestick chart) is a style of financial chart used to describe price movements of a security, derivative, or currency.
OHLC chart - An open-high-low-close chart (also OHLC) is a type of chart typically used to illustrate movements in the price of a financial instrument over time.
Area chart - An area chart or area graph displays graphically quantitative data. It is based on the line chart. The area between axis and line are commonly emphasized with colors, textures and hatchings. Commonly one compares two or more quantities with an area chart.
Renko chart - A renko chart is a type of financial chart of Japanese origin used in technical analysis that measures and plots price changes.
Kagi chart - The Kagi chart is a chart used for tracking price movements and to make decisions on purchasing stock.
Line chart - A line chart a type of chart which displays information as a series of data points called 'markers' connected by straight line segments.
Moving average - In statistics, a moving average is a calculation to analyze data points by creating a series of averages of different subsets of the full data set.
Bollinger Bands - Bollinger Bands are a type of statistical chart characterizing the prices and volatility over time of a financial instrument or commodity, using a formulaicmethod propounded by John Bollinger in the 1980s.
Parabolic SAR - In stock and securities market technical analysis, parabolic SAR (parabolic stop and reverse) is a method devised by J. Welles Wilder, Jr., to find potential reversals in the market price direction of traded goods such as securities or currency exchanges such as forex.
Volume chart - The Volume Chart shows the number of shares that have been traded over a given period.
MACD - MACD is a momentum and trend-following indicator that uses three different moving averages.
Force Index - The force index (FI) is an indicator used in technical analysis to illustrate how strong the actual buying or selling pressure is.
RSI(Relative Strength Index) - It is intended to chart the current and historical strength or weakness of a stock or market based on the closing prices of a recent trading period.
ATR - ATR is a volatility indicator. A high (or low) ATR indicates that a stock is more (or less) volatile.
Stochastic oscillator - In technical analysis of securities trading, the stochastic oscillator is a momentum indicator that uses support and resistance levels.
Samsara Game是一款很好玩的冒险类游戏,很家有一些关卡过不去,不知道通关技巧,小编整理了Samsara Game全关卡视频通关攻略,有需要的小伙伴可以看一下,希望可以帮助到大家。
背景故事
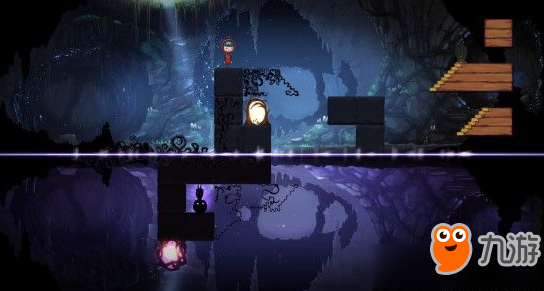
故事讲述了我们的主角小希在轮回空间里迷路了,也因此开始了一场既美丽又迷惑的奇幻之旅。
这款益智游戏质量非常的高,共计超过70多道物理谜题。且游戏的场景分为2个维度。
每个维度对木块的反应是...
Samsara Game第四关拥有三个梯形方块,通关肯定与这三个梯形方块有关,我们该如何使用好这些道具,下面一起和九游小编来看看Samsara Game第四关图文攻略。
Samsara Game全关卡图文攻略
Samsara Game第四关图文攻略
开局游戏,拥有三个梯形方块,这里我们不需要将前面的路完全搭建,只需要将前面部分弄一点就可以啦!
因为主角会给我们一些惊喜的啊~
首先在下...
Samsara Game第二关相比第一关还是有一定难度的,很家就卡在了第二关,下面小编给大家详细介绍一下通关技巧,有需要的小伙伴可以参考一下,说不定看完就能通关了呢。
Samsara Game全关卡图文攻略
Samsara Game第二关图文攻略
解锁第一关之后,就可以获得官方给的五个提示哦!
所以这一关解答十分的简单,点击提示之后,系统就会将所需的木块及摆放位置,
都将一一提示出来~ ...