Chart Game Person vs Monkey玩不了怎么办游戏攻略
A stock investment game between monkeys and fund managers ended with the monkey's victory.
In Korea, there was a stock investment game between parrots and individual investors. it also ended with a parrot's victory.
Since these two games were conducted within less than 10 months, it is hard to say that 'monkeys are better than humans'.
Now let's start the game in a new way.
Monkeys and you are playing an investment game with same stocks.
When the game starts, a chart of stocks appear randomly.
Monkeys have already bought stocks one year ago at the time when the game begins, and you can buy and sell stocks by analyzing charts over a period of one year.
In other words, a monkey is a long-term investor who buys and holds stocks over a two-year period, and you are a short-term investor who can do short-term trading by analyzing your charts.
When the period of a year ends, you can compare your return with the monkeys', and you can extend the duration for investment if necessary. (Item required.)
When the investment is over, you can check which company you invested with the monkey, the period of time, and the company's information.
Win the competition with monkeys and increase your wealth to become the world's richest person.
► The data provided in the game is actual historical stock data for the US, South Korea, and Japan.
► The exchange rate in the game is $1 = ¥100 = ₩1000.
◆◆◆ You can analyze charts with various kinds of charts and indicators. ◆◆◆
Candlestick chart - A candlestick chart (also called Japanese candlestick chart) is a style of financial chart used to describe price movements of a security, derivative, or currency.
OHLC chart - An open-high-low-close chart (also OHLC) is a type of chart typically used to illustrate movements in the price of a financial instrument over time.
Area chart - An area chart or area graph displays graphically quantitative data. It is based on the line chart. The area between axis and line are commonly emphasized with colors, textures and hatchings. Commonly one compares two or more quantities with an area chart.
Renko chart - A renko chart is a type of financial chart of Japanese origin used in technical analysis that measures and plots price changes.
Kagi chart - The Kagi chart is a chart used for tracking price movements and to make decisions on purchasing stock.
Line chart - A line chart a type of chart which displays information as a series of data points called 'markers' connected by straight line segments.
Moving average - In statistics, a moving average is a calculation to analyze data points by creating a series of averages of different subsets of the full data set.
Bollinger Bands - Bollinger Bands are a type of statistical chart characterizing the prices and volatility over time of a financial instrument or commodity, using a formulaicmethod propounded by John Bollinger in the 1980s.
Parabolic SAR - In stock and securities market technical analysis, parabolic SAR (parabolic stop and reverse) is a method devised by J. Welles Wilder, Jr., to find potential reversals in the market price direction of traded goods such as securities or currency exchanges such as forex.
Volume chart - The Volume Chart shows the number of shares that have been traded over a given period.
MACD - MACD is a momentum and trend-following indicator that uses three different moving averages.
Force Index - The force index (FI) is an indicator used in technical analysis to illustrate how strong the actual buying or selling pressure is.
RSI(Relative Strength Index) - It is intended to chart the current and historical strength or weakness of a stock or market based on the closing prices of a recent trading period.
ATR - ATR is a volatility indicator. A high (or low) ATR indicates that a stock is more (or less) volatile.
Stochastic oscillator - In technical analysis of securities trading, the stochastic oscillator is a momentum indicator that uses support and resistance levels.
游戏运营离不开数据的统计与分析,目前市面上有大量的统计分析类产品,但是用到游戏当中还得选择一款真正适合的分析工具。关注分析工具背后的特点和技术,才能真正筛选到好产品。
接入的成本
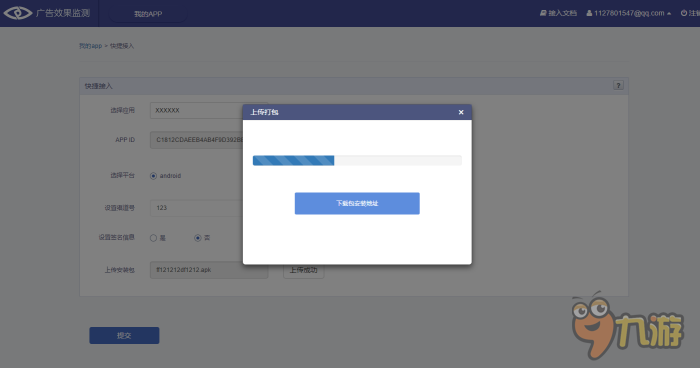
目前困扰移动开发者最大的因素就是接入SDK的负担,一款游戏新上线等待接入的SDK可以用成堆来形容,如果每一种SDK都要花费大堆的时间接入,那么这对于开发者来说是不可忍受的事情,所以在选择工具的过程中接入成本就是第一考...
导读:最近很多玩家都在关注Y game这款手游,想知道具体的公测时间,Y game会经过封测、删档内测、不删档测试到最终的公测等几个测试阶段,才会正式上线Y game安卓或iOS版本,有很多玩家就会问小编Y game什么时候公测,究竟什么时候出呢?今天小编就为大家提供如何快速地知道Y game开放下载和公测的时间,你就可以最快知道Y game公测时间了!
Y game什么时候公测?公测时间提前预...
Samsara Game第七关提供两个小梯形方块、一个大梯形方块,我们如何使用这些道具进行通关呢?小伙伴们是不是也卡在这一关上了,下面一起和九游小编来看看Samsara Game第七关图文攻略。
Samsara Game全关卡图文攻略
Samsara Game第七关图文攻略
首先将一个小梯形方块,倒立放置,这样就形成了一个楼梯样子哦!
然后再将大梯形方块倒立放置。弄成一条直路~
最后...